
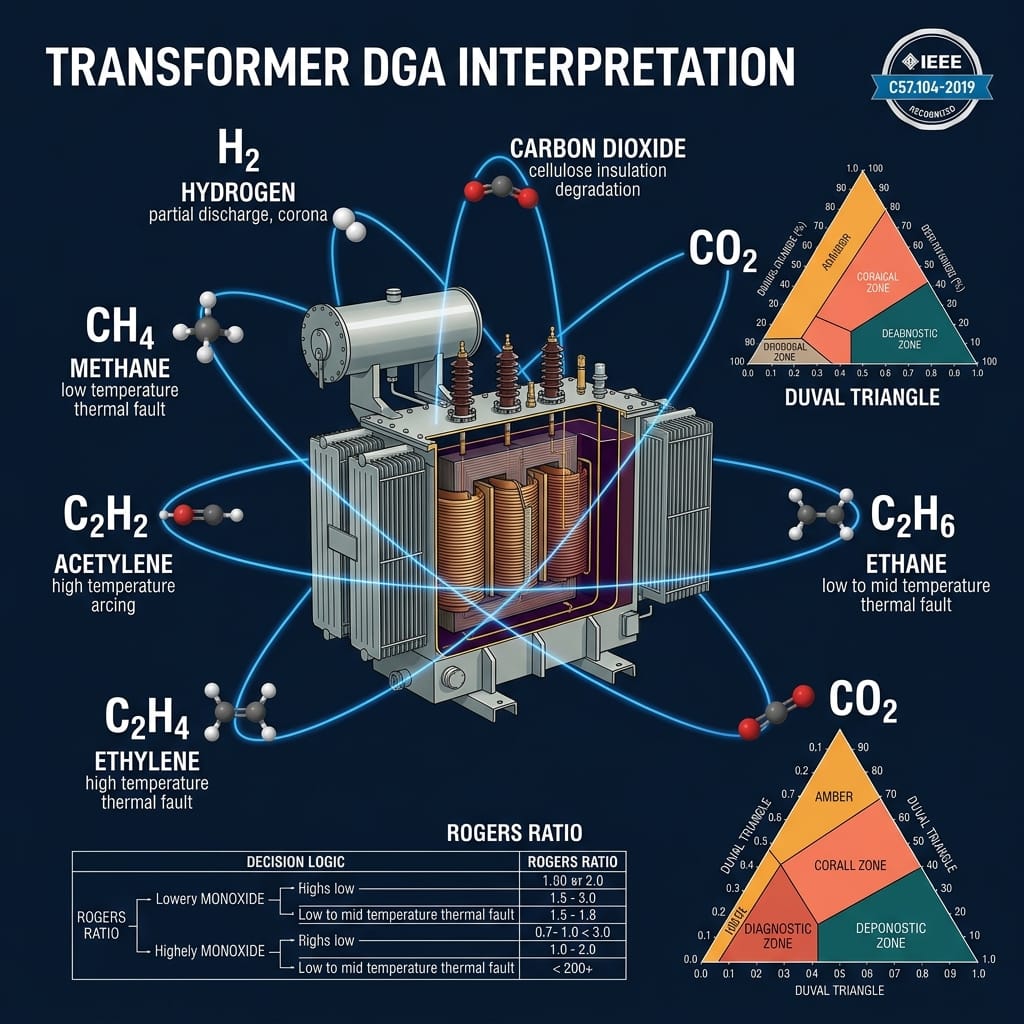
I’ve been involved in transformer manufacturing and quality testing for over a decade at our factory. One of the most frequent questions we get from clients right after delivery is: “We got a DGA report — what does this number mean, and should we be worried?”
Dissolved gas analysis (DGA) is the most powerful non-invasive diagnostic tool for oil-filled transformers. But the real value comes only from correct interpretation. A single elevated gas reading can mean very different things depending on which gas it is, how fast it’s rising, and what methods you use to analyze it.
This guide gives you the exact framework that field engineers use — gas limits from IEEE C57.104-2019, the Duval Triangle method, Rogers Ratios, and real actions to take when results are abnormal.
1. What Is Dissolved Gas Analysis in Transformers?
Dissolved gas analysis (DGA) is the process of extracting and measuring the concentration of key gases that have dissolved into transformer insulating oil over time. When electrical or thermal stress occurs inside a transformer, the oil and solid insulation (cellulose paper) decompose and release specific gases. These gases dissolve into the oil and act as “fingerprints” of what’s happening inside the unit — without opening it.
The DGA test is typically performed by:
- Collecting an oil sample from the transformer’s sampling valve (following NFPA 70E safety procedures)
- Extracting dissolved gases using a vacuum gas extraction apparatus
- Analyzing gas composition via gas chromatography (per ASTM D3612)
- Interpreting results against standards like IEEE C57.104-2019 and IEC 60599
Unlike Buchholz relay protection — which only triggers during major fault gas releases — DGA detects incipient faults: problems that are still small but growing. This early warning capability is why major utilities worldwide perform DGA on every critical transformer at least annually.
At our factory, we perform a baseline DGA on all oil-immersed transformers before shipment. This baseline becomes the “fingerprint” that future readings are compared against — a critical reference point that many users overlook.
How to Read a DGA Report: Step-by-Step
If you’ve just received a DGA report and don’t know where to start, follow this 4-step framework before jumping to any conclusions:
Add up: H₂ + CH₄ + C₂H₂ + C₂H₄ + C₂H₆ + CO. If below 720 PPM → normal, continue to step 2 for detail. If above 1,920 PPM → escalate immediately regardless of individual gas readings.
This is your highest-priority individual gas. Any reading above 1 PPM (sealed) or 3 PPM (free-breathing) requires action regardless of other values — stop and investigate before continuing analysis.
Find the last 1–2 DGA reports. Calculate whether any gas has doubled in less than 6 months. A rapidly rising gas — even below threshold — is more concerning than a stable high reading.
Calculate %CH₄, %C₂H₄, %C₂H₂ and plot on the triangle. This tells you what kind of fault is occurring (thermal vs. electrical), which determines your next maintenance action.
Only after completing all 4 steps do you have enough information to make a sound maintenance decision. Read on for the complete detail behind each step.
2. The 7 Key Fault Gases and What They Mean
The gases generated in transformer insulating oil are not random — each one points to a specific temperature range or type of stress. Understanding this gas-to-fault mapping is the foundation of DGA interpretation.
| Gas | Symbol | Primary Source | Fault Indicated | Temp. Range |
|---|---|---|---|---|
| Hydrogen | H₂ | Oil decomposition | Partial discharge, corona, low-energy arcing | All ranges |
| Methane | CH₄ | Oil decomposition | Low-temperature thermal fault, overheating | 150°C – 300°C |
| Ethane | C₂H₆ | Oil decomposition | Medium-temperature thermal fault | 150°C – 300°C |
| Ethylene | C₂H₄ | Oil decomposition | High-temperature hot spot, localized overheating | >300°C (spikes at >700°C) |
| Acetylene | C₂H₂ | Oil decomposition at extreme heat | High-energy electrical arcing — most critical gas | >700°C |
| Carbon Monoxide | CO | Cellulose insulation breakdown | Paper insulation degradation or thermal fault on cellulose | Moderate to high |
| Carbon Dioxide | CO₂ | Cellulose insulation breakdown | Paper overheating; high CO₂/CO ratio confirms paper degradation | General overheating |
Source: IEEE C57.104-2019; IEC 60599; Electrical4U — DGA Test of Transformer Oil
The Most Critical Gas: Acetylene (C₂H₂)
Acetylene deserves special attention. It only forms when temperatures exceed 700°C — conditions that indicate high-energy electrical arcing inside the transformer. Unlike other gases that can have multiple causes, acetylene above threshold is almost always a serious fault indicator.
In my experience reviewing factory test reports, a freshly commissioned transformer showing even 1–2 PPM of acetylene in its first DGA is a red flag that demands re-inspection before the unit goes into service. This has saved several of our customers from deploying transformers with internal defects that would have caused catastrophic failure within months.
The CO₂/CO Ratio: Diagnosing Paper Insulation Health
Carbon monoxide and carbon dioxide are both produced by cellulose degradation. The ratio between them is equally important:
- CO₂/CO ratio 4–11: Healthy cellulose insulation (normal range per IEC-599)
- CO₂/CO ratio >11: Indicates poor paper insulation condition — further investigation with Furan analysis recommended
- CO₂/CO ratio <4: May indicate very recent, rapid thermal fault affecting cellulose
3. IEEE C57.104-2019 Gas Concentration Limits
IEEE C57.104-2019 is the primary standard for DGA interpretation in North America. It provides 90th percentile benchmarks — meaning gas levels above these thresholds are higher than 90% of similar transformers in service. This is a statistical trigger for investigation, not a definitive fault boundary.
| Gas | Sealed (ONAN/ONAF) | Free-Breathing | Action if Exceeded |
|---|---|---|---|
| Hydrogen (H₂) | 100 PPM | 100 PPM | Increase sampling frequency; check for partial discharge |
| Methane (CH₄) | 120 PPM | 120 PPM | Investigate possible low-temp thermal fault |
| Ethylene (C₂H₄) | 50 PPM | 50 PPM | Urgent: high-temperature hot spot, plan offline inspection |
| Acetylene (C₂H₂) | 1 PPM | 3 PPM | Any detected: imminent arcing fault, consider immediate action |
| Ethane (C₂H₆) | 65 PPM | 65 PPM | Monitor; medium-temp thermal process likely |
| Carbon Monoxide (CO) | 900 PPM | 350 PPM | Check CO₂/CO ratio; consider Furan analysis for paper health |
| Carbon Dioxide (CO₂) | 10,000 PPM | 2,500 PPM | Review CO₂/CO ratio; high CO₂ with high CO = paper overheating |
Source: IEEE C57.104-2019 Table 1 (90th percentile values). Note: These are statistical benchmarks — 90% of similar in-service transformers fall below these values. They trigger investigation, not automatic shutdown. Always refer to the current standard edition for authoritative limits, as values differ by transformer type, age, and conservation system.
TDCG: The Total Picture in One Number
IEEE C57.104-2019 also defines TDCG (Total Dissolved Combustible Gas) — the sum of all combustible fault gases. This single number gives a quick overall health indicator before you drill into individual gases.
| TDCG Level | TDCG Range | Condition | Recommended Action |
|---|---|---|---|
| Level 1 | < 720 PPM | Normal | Continue normal annual DGA sampling |
| Level 2 | 720–1,920 PPM | Elevated | Resample within 6 months; investigate individual gases |
| Level 3 | 1,920–4,630 PPM | High | Resample within 1 month; apply Duval Triangle; consider load reduction |
| Level 4 | > 4,630 PPM | Critical | Immediate action; take offline or reduce load; physical inspection required |
Source: IEEE C57.104-2019, Table 2. TDCG provides the fastest preliminary screening before individual gas analysis.
4. How to Use the Duval Triangle Method
The Duval Triangle, developed by Michel Duval and endorsed by IEC 60599, is arguably the most widely used graphical DGA interpretation method. It eliminates the subjectivity of threshold-based analysis by plotting your gas results directly into a diagnostic zone.
How It Works
The method uses only three gases: CH₄ (Methane), C₂H₄ (Ethylene), and C₂H₂ (Acetylene). Calculate the percentage contribution of each:
%C₂H₄ = [C₂H₄ / (CH₄ + C₂H₄ + C₂H₂)] × 100
%C₂H₂ = [C₂H₂ / (CH₄ + C₂H₄ + C₂H₂)] × 100
Plot this point on the triangle to identify the fault zone:
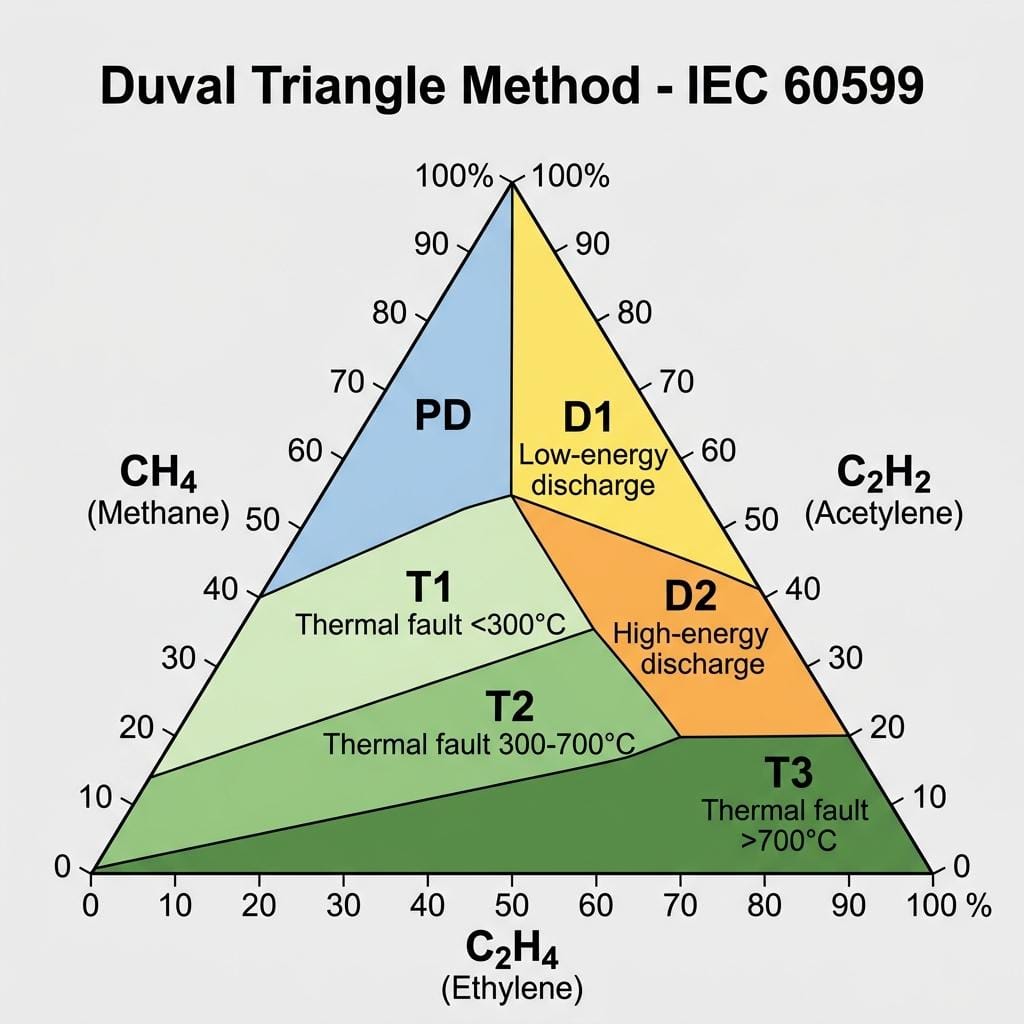
| Zone | Fault Type | Description | Urgency |
|---|---|---|---|
| PD | Partial Discharge | Corona or low-energy discharge in gas-filled voids | 🟡 Monitor closely |
| D1 | Low-Energy Discharge | Sparking or tracking between conductors in oil | 🟠 Increased monitoring + inspection |
| D2 | High-Energy Discharge | High-energy arcing; risk of transformer failure | 🔴 Immediate action |
| T1 | Thermal Fault <300°C | Overheated insulation or connections; low severity | 🟡 Monitor; check load levels |
| T2 | Thermal Fault 300–700°C | Significant hot spot; localized overheating | 🟠 Plan maintenance intervention |
| T3 | Thermal Fault >700°C | Severe hot spot; oil and paper decomposing rapidly | 🔴 Urgent inspection required |
| DT | Mixed Thermal+Discharge | Multiple simultaneous fault mechanisms | 🔴 Comprehensive diagnostic needed |
Worked Example: Duval Triangle Calculation
Suppose a DGA report shows: CH₄ = 45 PPM, C₂H₄ = 30 PPM, C₂H₂ = 5 PPM.
- Total = 45 + 30 + 5 = 80 PPM
- %CH₄ = 45/80 × 100 = 56.3%
- %C₂H₄ = 30/80 × 100 = 37.5%
- %C₂H₂ = 5/80 × 100 = 6.3%
Plotting this on the Duval Triangle places the point in the D1 (Low-Energy Discharge) zone — indicating sparking or tracking, with the low ethylene ruling out a purely thermal origin.
Recommended actions: (1) Immediately notify asset owner of C₂H₂ exceedance; (2) Resample within 30 days; (3) Arrange infrared thermography scan; (4) Run Rogers Ratios to confirm D1 vs D2 boundary; (5) Plan offline inspection if next sample shows further C₂H₂ increase.
5. Rogers Ratios: A Complementary Method
The Rogers Ratio method uses the ratios of three key gas pairs to identify fault types. It provides a systematic alternative to the Duval Triangle, particularly useful for confirmation of borderline results.
| C₂H₂/C₂H₄ | CH₄/H₂ | C₂H₄/C₂H₆ | Fault Type |
|---|---|---|---|
| <0.1 | 0.1–1.0 | <1 | Normal aging (no active fault) |
| <0.1 | <0.1 | <1 | Partial discharge |
| 0.1–3.0 | <0.1 | 1–3 | Low-energy electrical discharge (D1) |
| >3.0 | 0.1–1.0 | >3 | High-energy arcing (D2) |
| <0.1 | 0.1–1.0 | 1–3 | Thermal fault <300°C (T1) |
| <0.1 | >1.0 | 1–3 | Thermal fault 300–700°C (T2) |
| <0.1 | >1.0 | >3 | Severe thermal fault >700°C (T3) |
Source: Rogers (1978), as referenced in IEEE C57.104-2019 Annex C. Note: This is a simplified 3-ratio version for field use. The original Rogers method included a 4th ratio (C₂H₆/CH₄); IEEE C57.104-2019 now primarily endorses the Duval Triangle as the preferred graphical method, with Rogers Ratios as a supplementary tool. Results can be ambiguous when gas concentrations are near lab detection limits (<5 PPM).
6. Why Trends Matter More Than Single Readings
One of the most common mistakes I see engineers make is treating a DGA result as a pass/fail test. A single data point is almost never enough to make a maintenance decision. What matters more is the rate of change — how fast are the gases increasing?
Consider two scenarios:
- Scenario A: H₂ = 150 PPM (above 90th percentile), stable for 3 years → likely established equilibrium, lower urgency
- Scenario B: H₂ = 80 PPM (below threshold), but jumped from 20 PPM in just 2 months → active and accelerating fault, high urgency
Scenario B is actually more dangerous despite having a lower absolute value. This is why IEEE C57.104-2019 emphasizes trend analysis, and why consistent sampling intervals (quarterly or annually) are critical.
Gas Generation Rate Calculation
Gas Generation Rate (PPM/day) = (C₂ − C₁) / Days between samples
Example: H₂ rose from 40 PPM to 120 PPM over 90 days
Rate = (120−40)/90 = 0.89 PPM/day → requires monthly monitoring
As a practical rule from our factory experience: any gas generation rate that doubles the current concentration in less than 6 months warrants immediate offline inspection planning.
7. Real Cases from Our Factory: What We Found
Case 1: The “False Alarm” — High CO₂ After Oil Refill
From our factory service records — distribution transformer, coastal industrial facility.
A customer returned a 630 kVA oil-immersed distribution transformer after a flood event with CO₂ readings of 14,000 PPM — well above the 10,000 PPM threshold. Their maintenance team was ready to scrap the unit.
Before we agreed, we reviewed the history: the transformer had undergone oil degassing and refill 8 weeks earlier after flood water contamination. Post-degassing, CO₂ levels naturally re-accumulate. The CO was only 320 PPM, giving a CO₂/CO ratio of 43 — unusually high, but in this case caused by rapid atmospheric CO₂ absorption due to incomplete sealing.
We recommended a re-test at 90 days. The result: CO₂ dropped to 3,200 PPM, CO stabilized at 180 PPM. The transformer was perfectly serviceable. Lesson: always account for maintenance history when interpreting DGA results.
Case 2: The Dangerous Reading Everyone Almost Ignored
From our technical support records — padmount transformer, light manufacturing application.
A 1,000 kVA padmount transformer serving a manufacturing facility had its annual DGA done. H₂ = 87 PPM (below 100 PPM threshold), CH₄ = 95 PPM (below 120 PPM threshold). On threshold alone, the report would be marked “acceptable.”
But compared to the previous year’s reading (H₂ = 11 PPM, CH₄ = 14 PPM), both gases had increased by roughly 8× in 12 months. The Duval Triangle placed the point in the T2 zone. We advised immediate thermal imaging — the scan revealed a loose LV bushing connection running at 140°C above ambient. Tightening the connection solved the problem before any winding damage occurred.
Lesson: Run the Duval Triangle and always compare to baseline. Absolute values alone can mislead.
8. Decision Tree: What to Do After Getting DGA Results
| Situation | Recommended Action | Timeline |
|---|---|---|
| All gases below 90th percentile, stable | Continue annual DGA schedule | 12 months |
| Any gas above 90th percentile (first time) | Increase to quarterly sampling; apply Duval Triangle | 3 months |
| Gas doubling rate <6 months, Duval = T2/T3 | Monthly sampling; schedule infrared scan; plan offline inspection | 1 month |
| C₂H₂ detected above threshold, Duval = D2 | Consider immediate load reduction; expedite offline inspection | Immediate |
| Rapidly rising gases across multiple types + Buchholz alarm | Take transformer offline; do not re-energize without physical inspection | Emergency |
For a transformer showing concerning DGA trends, consider consulting our engineering team — we offer DGA assessment support as part of our oil-immersed transformer services.
Online vs. Offline DGA: Which Should You Use?
| Feature | Offline (Lab) DGA | Online DGA Monitor |
|---|---|---|
| Data frequency | Point-in-time (annual/quarterly) | Continuous real-time |
| Gas coverage | All 7 gases + furans, moisture, BDV | Key fault gases (3–7 depending on model) |
| Cost | Low (per sample) | Higher capital, low ongoing cost |
| Best for | All transformers; baseline & annual check | Critical assets, generation step-up, substation GSUs |
| Detects rapid fault development | ❌ May miss between samples | ✅ Immediate alert |
Best practice: combine both. Use annual lab DGA for your full fleet, and deploy online DGA monitors on critical units (MVA >10, or serving essential loads).
Frequently Asked Questions: Transformer DGA Interpretation
What does high acetylene (C₂H₂) in a DGA report mean?
Acetylene above 1–2 PPM in a sealed transformer is a serious warning sign indicating high-energy electrical arcing inside the unit. Even small concentrations demand immediate investigation and may require taking the transformer offline for inspection. Do not dismiss elevated acetylene readings — it is the most critical fault gas in DGA.
What are the IEEE C57.104-2019 gas concentration limits?
IEEE C57.104-2019 defines 90th percentile benchmarks: H₂ <100 PPM, CH₄ <120 PPM, C₂H₂ <1 PPM (sealed), C₂H₄ <50 PPM, CO <900 PPM (sealed). These values indicate that 90% of similar units report lower concentrations — they trigger investigation, not automatic shutdown.
How often should I do a DGA test on my transformer?
At least once per year for routine monitoring. Increase to quarterly if abnormal gases are detected. Also perform DGA after commissioning, after any major fault event, and after maintenance work that exposed core and windings. After oil degassing, establish a new 3-month baseline before resuming normal intervals.
What is the Duval Triangle method in DGA interpretation?
The Duval Triangle plots the relative percentages of CH₄, C₂H₄, and C₂H₂ to identify fault type. The data point’s position within the triangle’s labeled zones (PD, D1, D2, T1, T2, T3, DT) diagnoses the primary fault mechanism — whether electrical discharge, thermal stress, or a combination. It is endorsed by IEC 60599 and is more reliable than threshold comparisons alone.
What is the difference between online and offline DGA monitoring?
Offline DGA requires an oil sample sent to a lab — comprehensive but captures only a single moment. Online monitors continuously measure key fault gases in real-time, providing trend data and immediate alerts for rapidly developing faults. Best results come from combining both: continuous online monitoring for critical assets, plus annual lab DGA for complete condition assessment.
Conclusion: DGA Is a System, Not a Single Test
Effective dissolved gas analysis interpretation depends on three things working together:
- Baseline reference — always request a DGA report on new transformers
- Regular trend tracking — rate of change matters more than absolute values
- Multiple interpretation methods — use both IEEE C57.104-2019 limits AND the Duval Triangle; use Rogers Ratios to confirm ambiguous results
A single “above threshold” reading shouldn’t panic you. A fast-rising trend in a key fault gas — especially acetylene — absolutely should. The goal of DGA interpretation is to give you enough early warning to plan maintenance on your schedule, not the transformer’s.
Need DGA Interpretation Support for Your Transformer Fleet?
Our engineering team at Transformer4U has reviewed hundreds of DGA reports across our manufacturing and customer support work. We supply oil-immersed transformers and dry-type transformers for industrial and utility applications globally.
Related Articles
- Transformer Oil Testing: Complete Guide to BDV, Acidity, and Moisture Tests
- Transformer Maintenance Checklist: Annual, Monthly, and Daily Inspections
- Oil-Immersed Power Transformers: Types, Specifications, and Applications
- Transformer Oil Types: Mineral, Ester, and Silicone — Which to Choose?
- Top 7 Causes of Transformer Failure and How to Prevent Them
Tan — Transformer Engineer @ Transformer4U
With over 10 years of experience in transformer design, quality testing, and technical support, Tan works at our manufacturing facility helping clients select, specify, and maintain industrial power transformers. He has personally reviewed DGA reports for hundreds of transformers ranging from 50 kVA distribution units to 50 MVA power transformers.